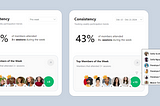
Published inThe BI CornerMy Best Power BI KPI Card (So Far π )π PBIX available for download at the end of this article!Jan 46Jan 46
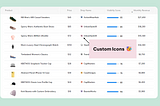
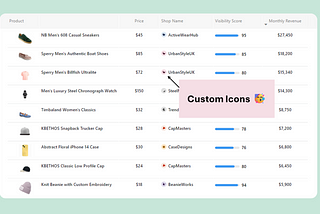
Published inThe BI CornerElevate Your Power BI Tables with Custom Icons π₯³Step-by-Step Guide with PBIX to Embedding Custom Icons in Your Power BI ReportsDec 31, 20244Dec 31, 20244
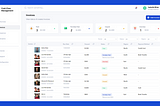
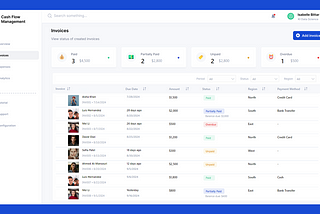
Published inThe BI CornerTransforming Power BI Tables: 6 Expert Tips for Smarter Data VisualizationBoost User Experience with These Power BI Table EnhancementsSep 19, 20241Sep 19, 20241
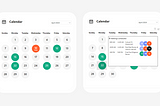
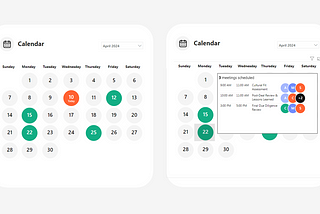
Published inThe BI CornerHow to Build a Dynamic Calendar Visual in Power BIA Step-by-Step Tutorial to Create an Interactive Calendar Dashboard in Power BIApr 12, 20249Apr 12, 20249
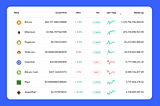
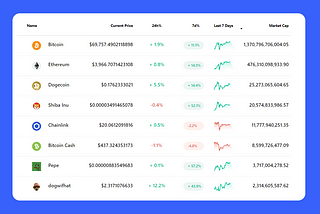
Published inThe BI CornerStep Up Your Power BI Game With SVGs π₯Building a Crypto Market Watch Dashboard in Power BI Using SVGsMar 10, 20244Mar 10, 20244
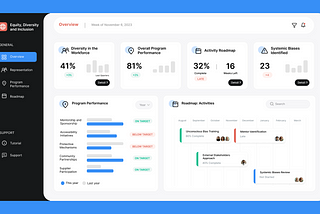
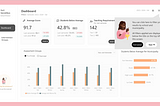
Published inThe BI CornerDesigning for Impact: 6 Ideas to Enhance the User Experience and Accessibility of Your Power BIβ¦A Journey Through the Design of an Equity, Diversity and Inclusion Power BI DashboardMar 2, 20245Mar 2, 20245
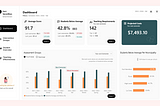
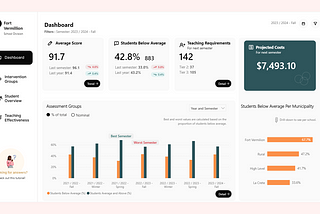
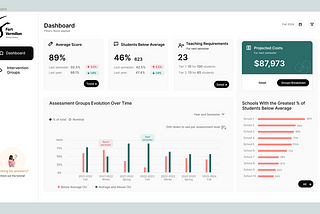
Published inThe BI Corner4 Tips to Work Efficiently in Power BI π οΈIn It to Win It π€ : Part 4 (Last One!) of Participating in the FP20 Analytics Challenge on Data-Driven Education ManagementFeb 18, 20247Feb 18, 20247
Published inMicrosoft Power BIBuilding Interactive Tutorials That Stick in Power BIIn It to Win It π€ : Part 3 of Participating in the FP20 Analytics Challenge on Data-Driven Education ManagementFeb 12, 20243Feb 12, 20243
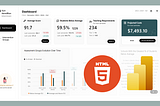
Published inMicrosoft Power BIElevating Power BI Reports with HTML & CSS: Joining Forces πͺIn It to Win It π€ : Part 2 of Participating in the FP20 Analytics Challenge on Data-Driven Education ManagementFeb 4, 20246Feb 4, 20246
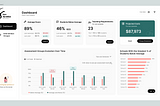
Published inMicrosoft Power BIHow to Design Attractive Power BI ReportsIn It to Win It π€ : Part 1 of Participating in the FP20 Analytics Challenge on Data-Driven Education ManagementJan 28, 20246Jan 28, 20246
Published inMicrosoft Power BILevel Up Your Dashboards With Power BIβs New & Improved Chart Data LabelsDiscover How to Utilize the New Features from Power BIβs December 2023 ReleaseJan 21, 20244Jan 21, 20244
Published inMicrosoft Power BIPower BI Time Hacks: Mastering Dynamic Date ViewsUnlock the Secrets to Flexible Daily, Weekly, Monthly Analysis in Your DashboardsJan 14, 20249Jan 14, 20249
Published inMicrosoft Power BINext-Level Dashboard Design With Power BIβs New Card Visual With Reference LabelsHarnessing the Full Potential of Power BIβs Latest KPI Card BreakthroughJan 7, 202410Jan 7, 202410
Published inMicrosoft Power BIFigma Meets Power BI: Revolutionizing Report DesignUnleashing Creativity and Efficiency in Data VisualizationDec 31, 202310Dec 31, 202310
Published inMicrosoft Power BINavigating Challenges in Illustrating Rates and Indexes in Power BI Line or Area ChartsMastering Time-Sensitive Data Visualization in Power BI: A Journey Through Rates and IndexesDec 21, 20231Dec 21, 20231
Published inMicrosoft Power BIHow To Dynamically Change Area or Line Chart Colors in Power BIMastering Visual Insights: A Step-by-Step Guide to Custom Color Dynamics in Power BI ChartsDec 17, 20231Dec 17, 20231
Published inMicrosoft Power BIUsing Time Periods as Slicers to Enhance Power BI Line or Area Chartsβ RangeEnhancing Data Visualization: Mastering Time Frame Selection in Power BI ReportsDec 13, 20234Dec 13, 20234
Published inMicrosoft Power BIHow To Use Power BIβs New Slicer: Building a Market Watch DashboardUnlocking Enhanced Customization and Interactivity for Dynamic Data AnalysisDec 10, 20235Dec 10, 20235
Published inMicrosoft Power BIMastering Bubble Charts in Power BI: Enhancing Data Narratives and User EngagementTransform Your Data: Innovative Techniques for Stunning Power BI Visualizations.Dec 1, 20231Dec 1, 20231
Published inMicrosoft Power BIEnhance Your Power BI Reports: 4 Dynamic Color Coding TechniquesUnlock the full potential of your Power BI bar charts with these innovative color coding strategies.Nov 22, 2023Nov 22, 2023